Data Science is hot. Fortunately, the recently released ebook The Art of Data Science (A Guide for Anyone Who Works with Data) doesn’t waste space on trendy technologies, and focuses instead on the enduring fundamentals of data analysis. I can forgive the authors for choosing a topical title, however, because few people are better qualified to capitalize on the trend as Johns Hopkins Professors (and expert data-handlers) Roger Peng and Elizabeth Matsui.
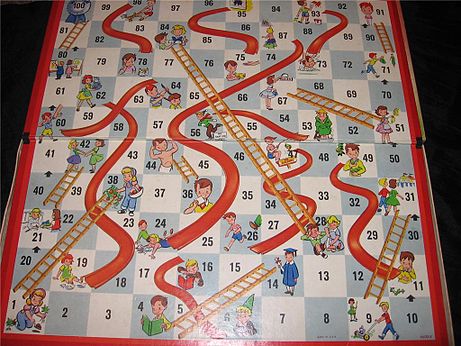
No exercises accompany this book, and although there are a few snatches of R code, it’s not meant to be used as a handbook for data analysis. Instead, it teaches readers how to think like a (productive) data analyst. Peng and Matsui break the process of analyzing data into a list of core activities, which begins with defining the question and ends with communicating the results. Instead of presenting this as a linear process, they describe an “epicycle of data analysis”, a pattern of thinking and acting that is repeated in all of the core activities. The authors explain that an analyst will often cycle through this pattern several times during a single activity, and that the process often sends scientists back to earlier steps. Readers learn that real world data analysis is like playing Chutes and Ladders on a board with no ladders.

I would recommend this book to any reader who’s interested in this year’s sexiest career – especially those annoyed that anybody would label a career “sexy”. However, I think this book is most valuable as a companion to introductory statistics classes, as it fills in key gaps left by traditional statistics curricula. This is particularly true for students, such as those at the beginning of a postgraduate education, who expect to analyze real data by the time the course has finished. Stats teachers have to cover a lot of ground in classes that begin with stories about ball-filled urns (some lucky students get actual candy) and end with ANOVA tables. In the end, few future scientists finish the term with much more than a list of specific tests that can be matched to familiar situations. Although most students gain additional training during their graduate student apprenticeship, an education in data analysis competes for time with the acquisition of domain knowledge and more specific skills. This often leads to a cargo-cult approach to data analysis among people who are specifically trained to seek out truth. I believe that reading this book will help counteract these shortcomings.
My favorite chapters discuss the process of building models of data, and I really appreciate that the authors describe the difference between modeling for inference (i.e., statistical modeling) and modeling for prediction (i.e., machine learning). As a grad student, I had completed my program’s required stats classes before I really understood the relationship between “running a (statistical) test” and “fitting a model”; learning this lesson earlier would have made me better at both. I also like that the book encourages analysts to build visualizations of their data early and often. This indispensable process has become much easier in recent years as new libraries in several programming languages streamline the process of tidying and plotting complicated data. The only section that I would like to see expanded is the chapter on communication, which might have benefitted from a brief discussion on building visualizations for an audience. I suppose that this omission may have been intentional; there are so many new developments in dataviz, such as a shift toward dynamic and interactive visualizations, that it would be difficult to write something that won’t soon be out of date.
If you’re new to data analysis, or interested in integrating a more formal (but still flexible) framework into your practice, I think you’ll find The Art of Data Science to be worth a look. It is a quick read and available at a pay-what-you-like price, so even poor grad students have no excuse not to.